rsRDisease Usage
Starting from a Disease Type
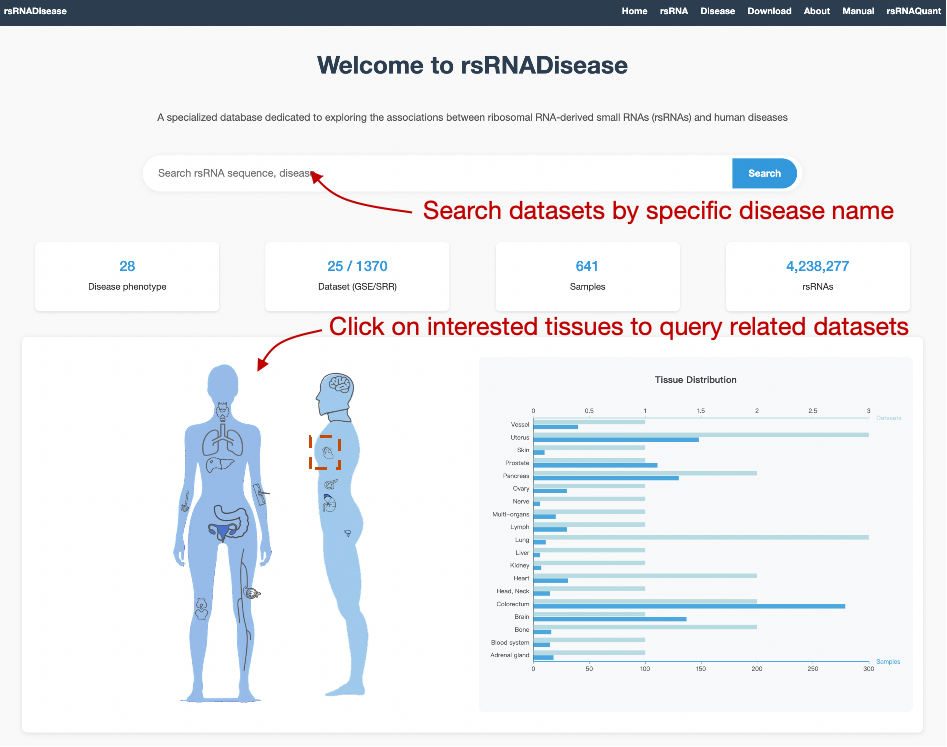
On the Home page, users interested in a specific disease type can either search for the disease name directly or click the corresponding tissue on the body map to explore related datasets.
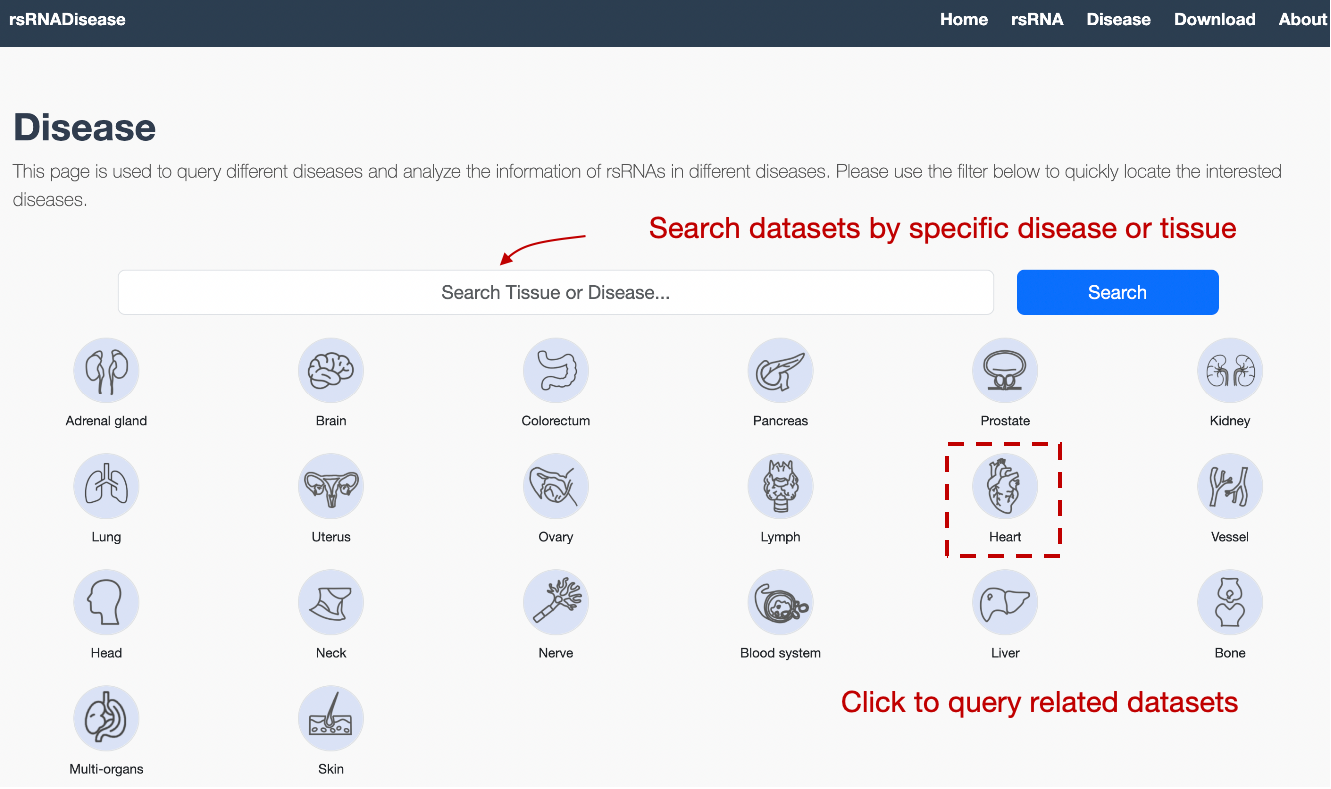
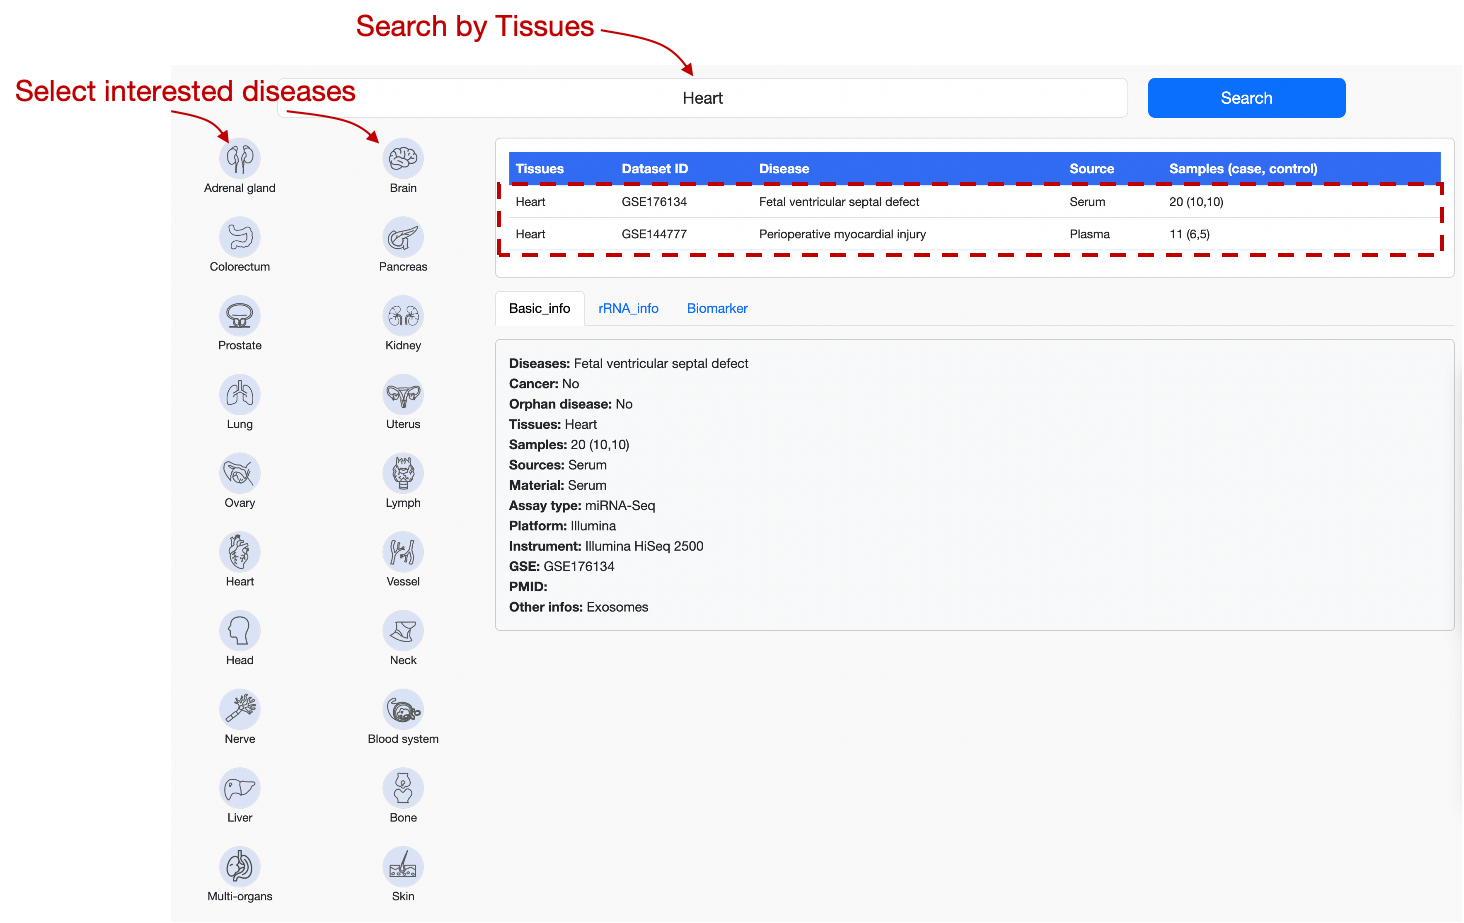
On the Disease page, users interested in a specific disease type can either search for the disease/tissue name directly or click the tissue card to explore related datasets.
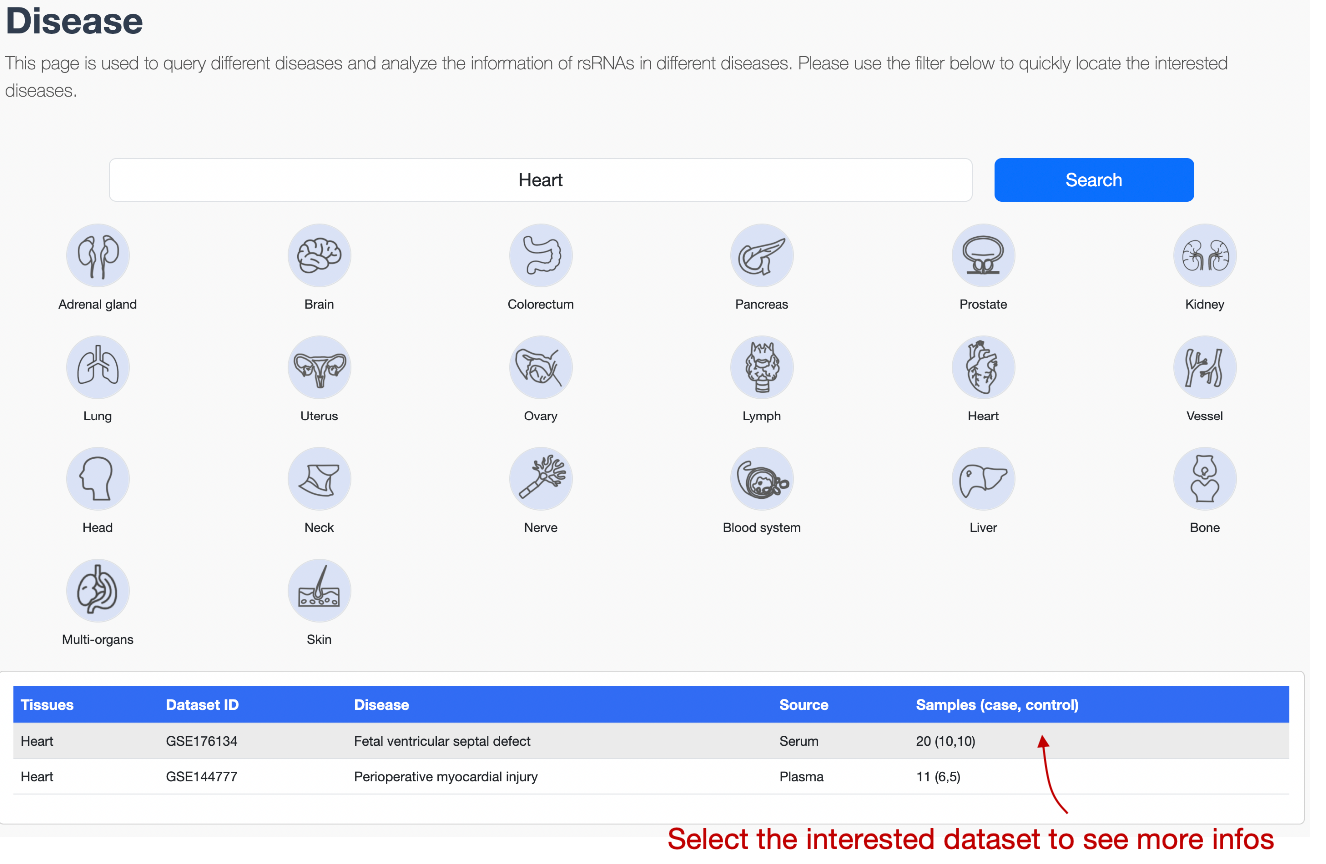
The datasets satisfying the conditions will be displayed in the table below the tissue cards. The result table shows relevant study information about each dataset, and users can click a dataset to view more details.
On this page, users can search tissues or diseases, switch datasets via the tissue cards on the left, or select datasets of interest in the result table.
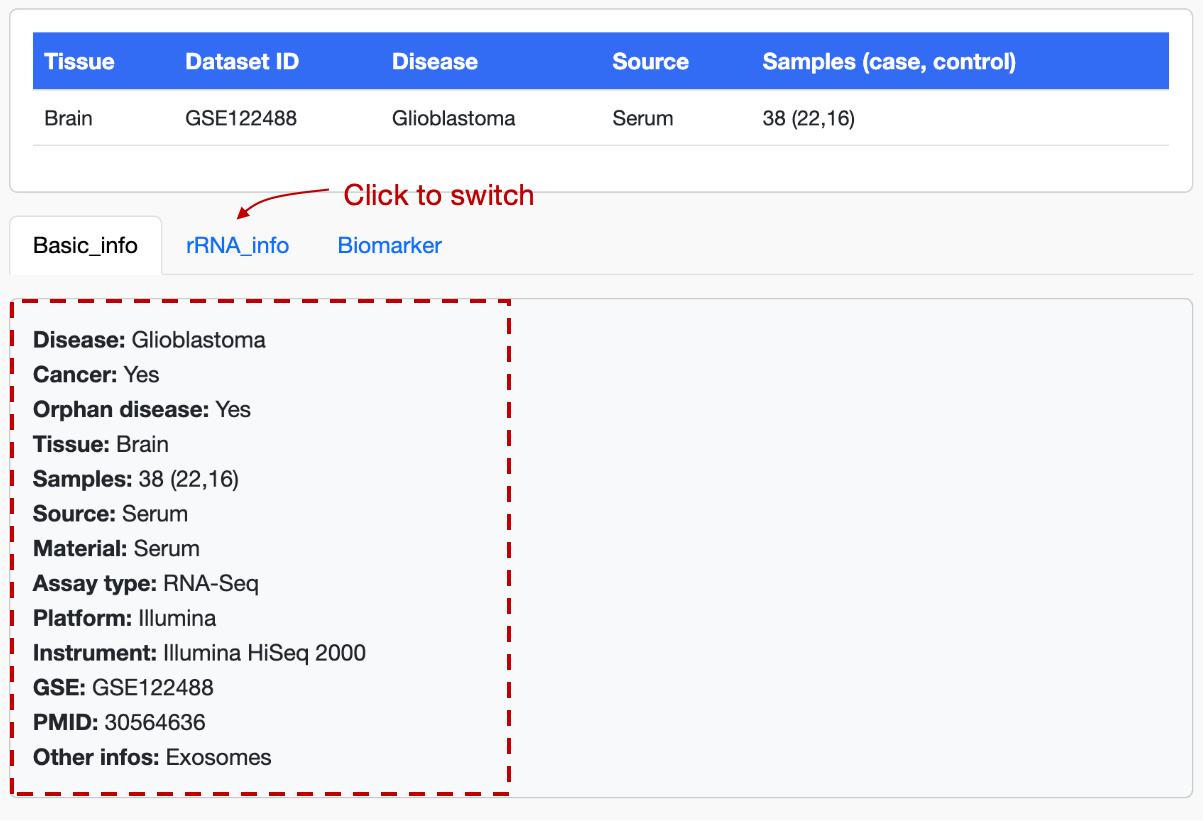
Users can switch tabs in the information panel to access desired information.
The Basic_info tab provides detailed dataset information including disease name, cancer status, tissue, sample numbers, source, material, assay type, platform, and instrument.
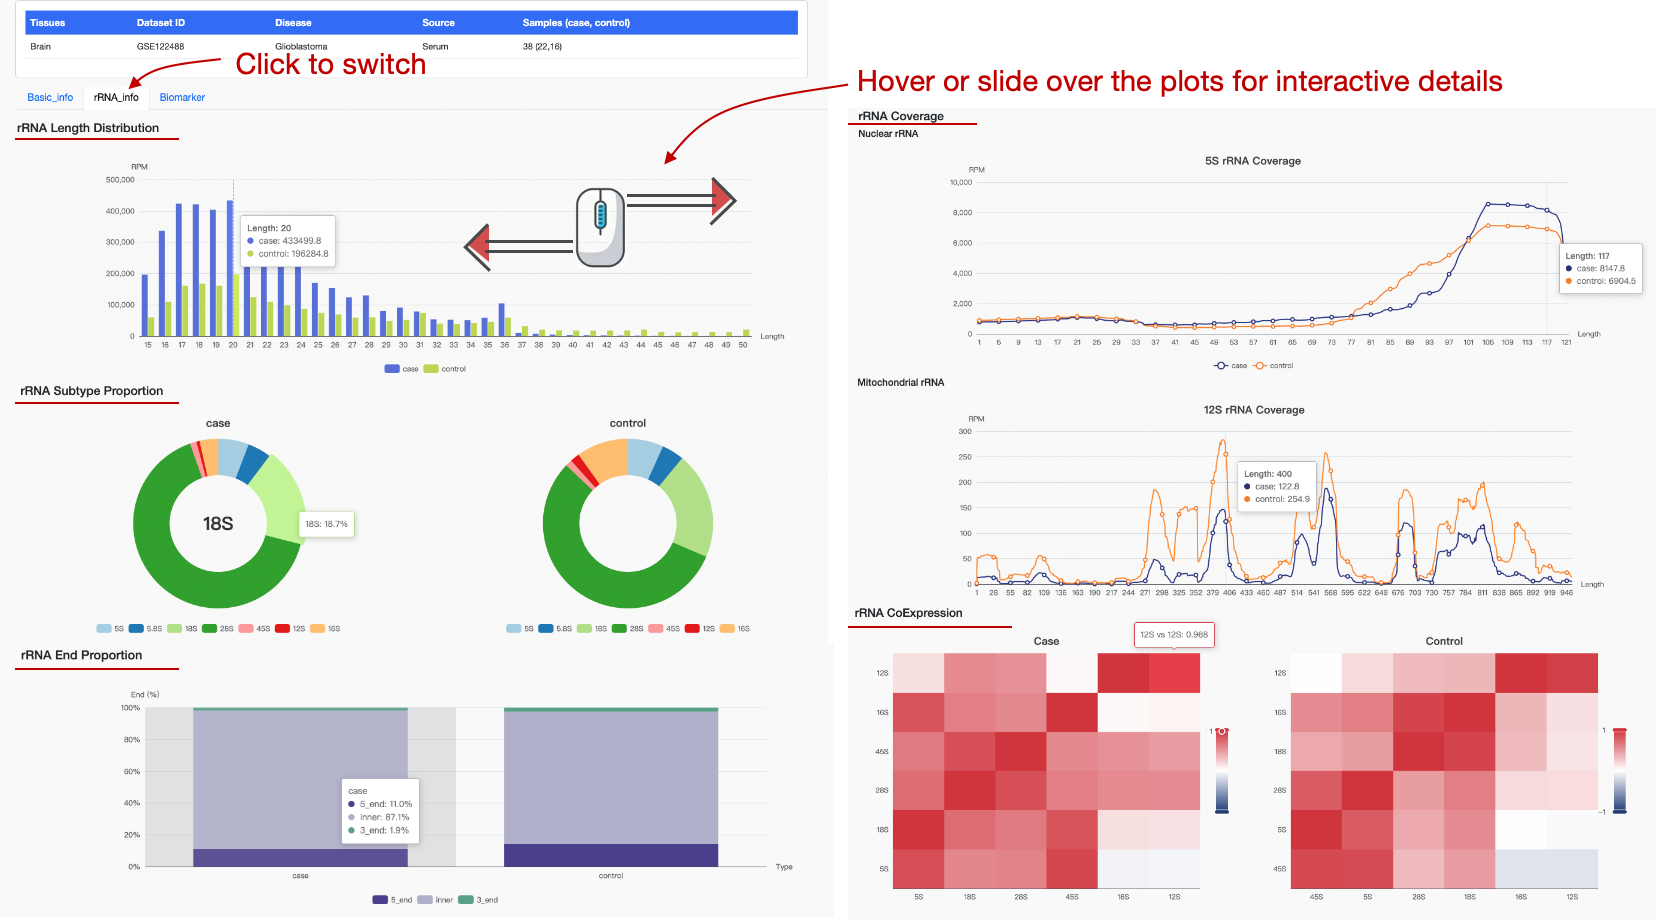
The rRNA_info tab provides up to five rRNA-related visualizations: Length Distribution, Subtype Proportion, End Proportion, Coverage, and CoExpression. Users can interact with the plots by hovering or sliding over points to explore more details, such as specific values.
* Note: Some datasets may lack enough samples for the CoExpression heatmap.
What users can obtain from the figures:
- rRNA Length Distribution: Obtain rsRNA expression levels at each length for disease and control groups.
- rRNA Subtype Proportion: Compare rsRNA expression from different rRNA subtypes between groups.
- rRNA End Proportion: View rsRNA expression from different ends in disease and control groups.
- rRNA Coverage: Select rRNA subtypes to view position-specific rsRNA expression for both groups.
- rRNA CoExpression: Explore correlation coefficients of rsRNA co-expression among rRNA subtypes.
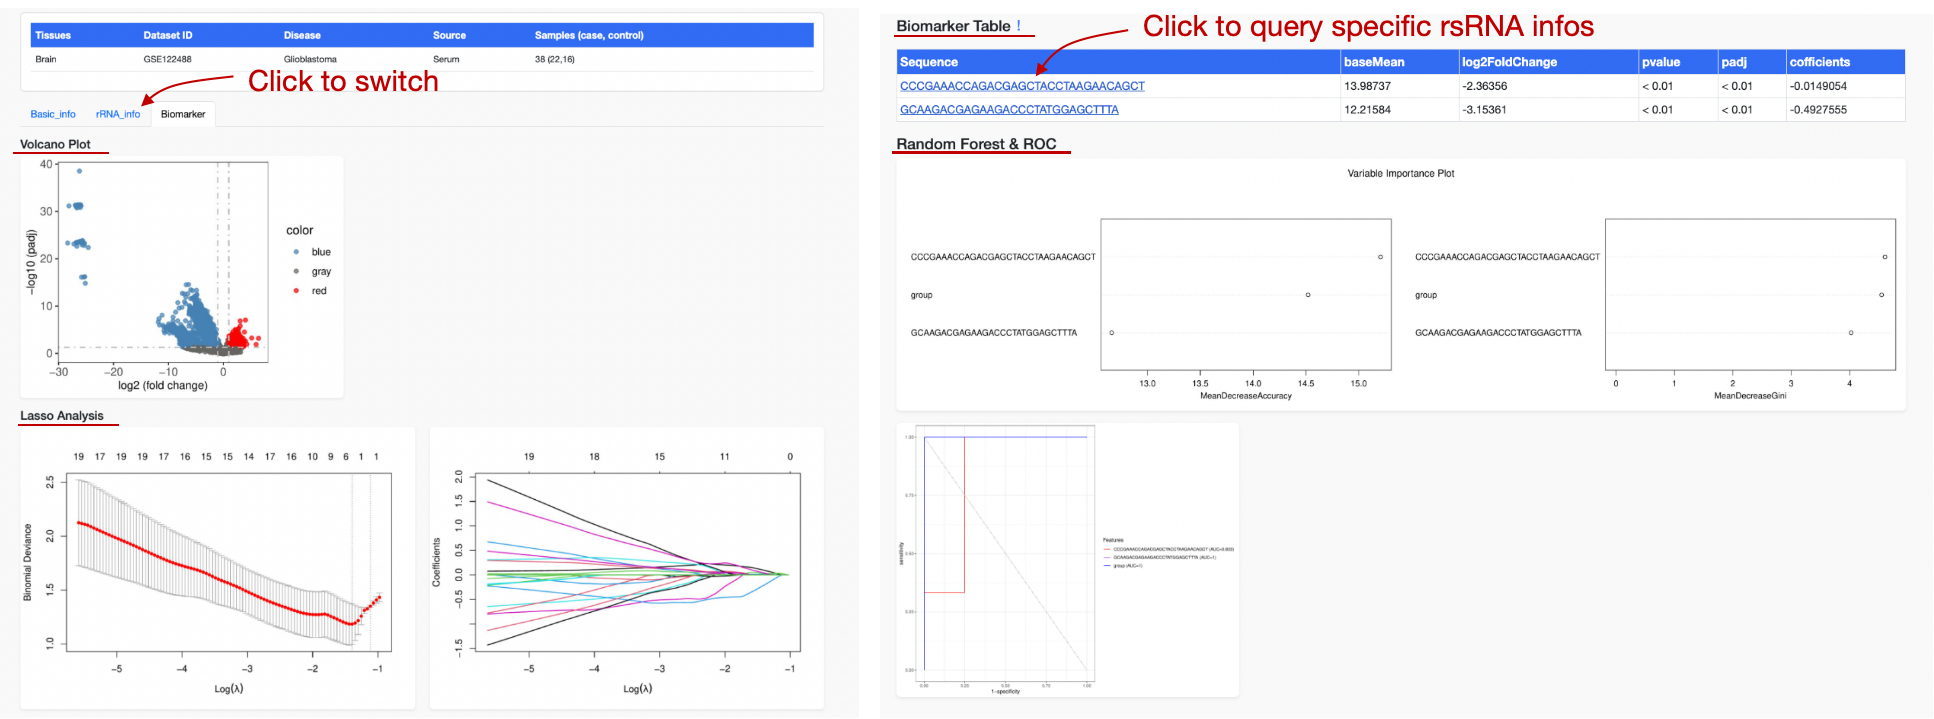
Users can select the Biomarker tab to view the volcano plot of differential analysis, the LASSO feature selection process, the Biomarker Table, the evaluation results of the random forest model, and the ROC curves.
The Biomarker Table lists a set of rsRNA signatures identified by machine learning that can distinguish disease samples from controls within the dataset. The table displays both differential analysis results and feature coefficients.
* Note: Some datasets may not contain content in the Biomarker tab due to insufficient sample size or the absence of suitable biomarkers for discrimination.
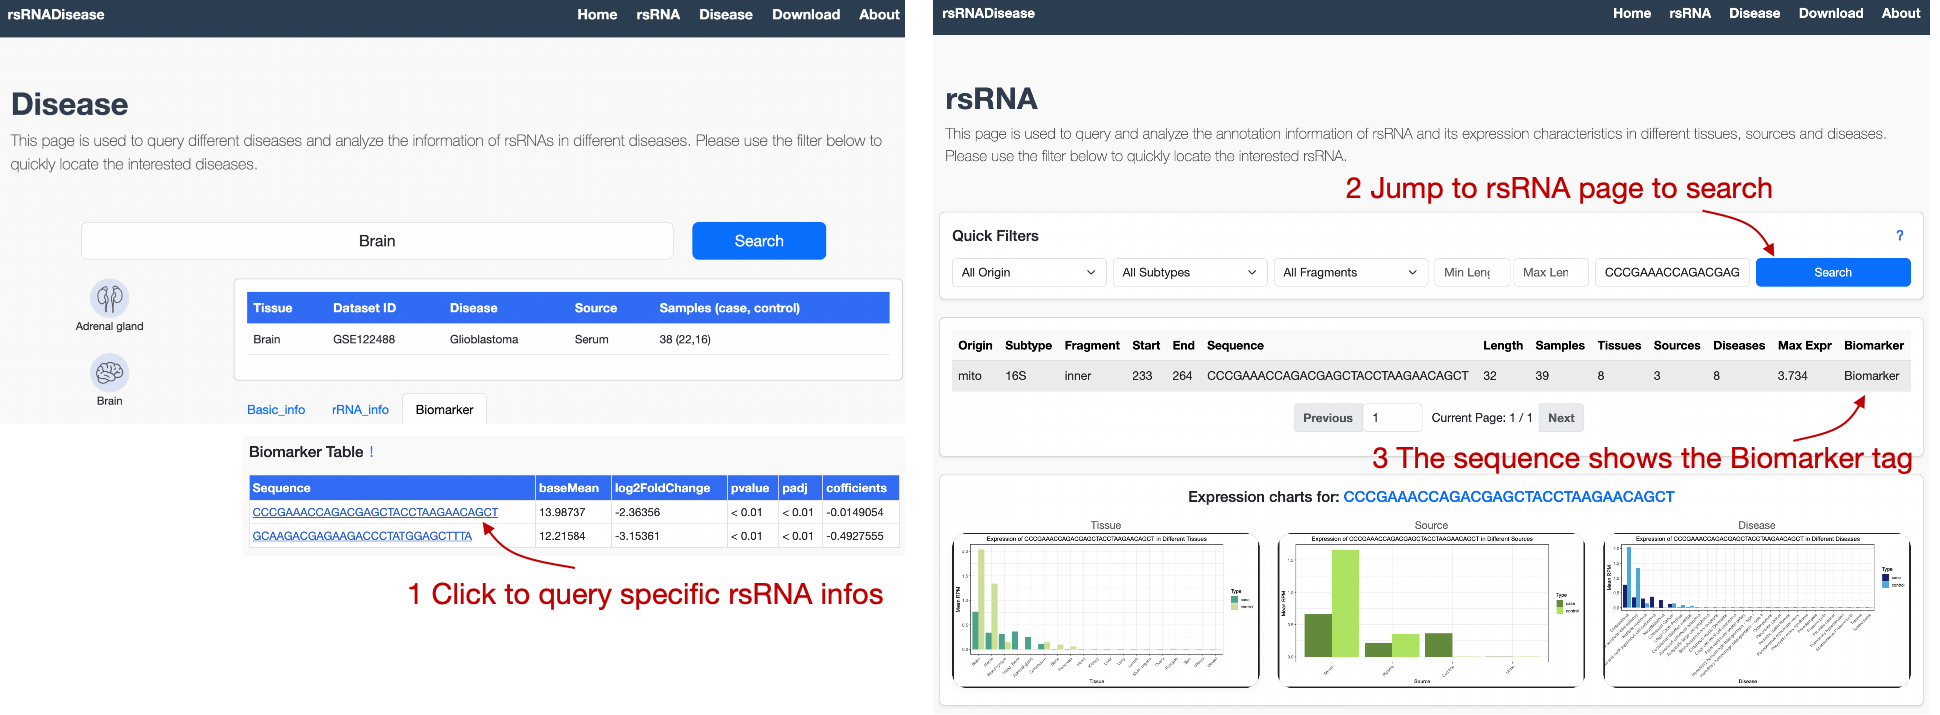
Data and Figure Access: ll figures can be downloaded for storage. Data in the Biomarker Table can also be copied and saved locally. Clicking a specific rsRNA sequence in the table redirects to the rsRNA page, where more detailed information about the sequence can be viewed.
Starting from an rsRNA
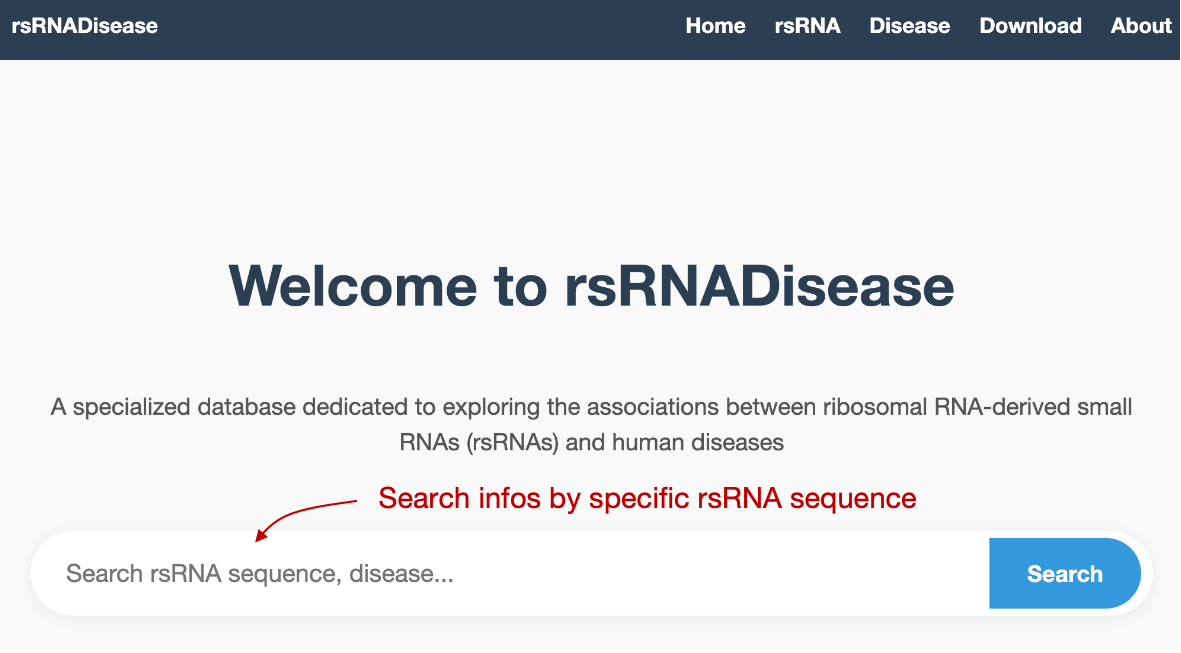
On the Home page, users can search for the rsRNA sequence directly to see the infos.
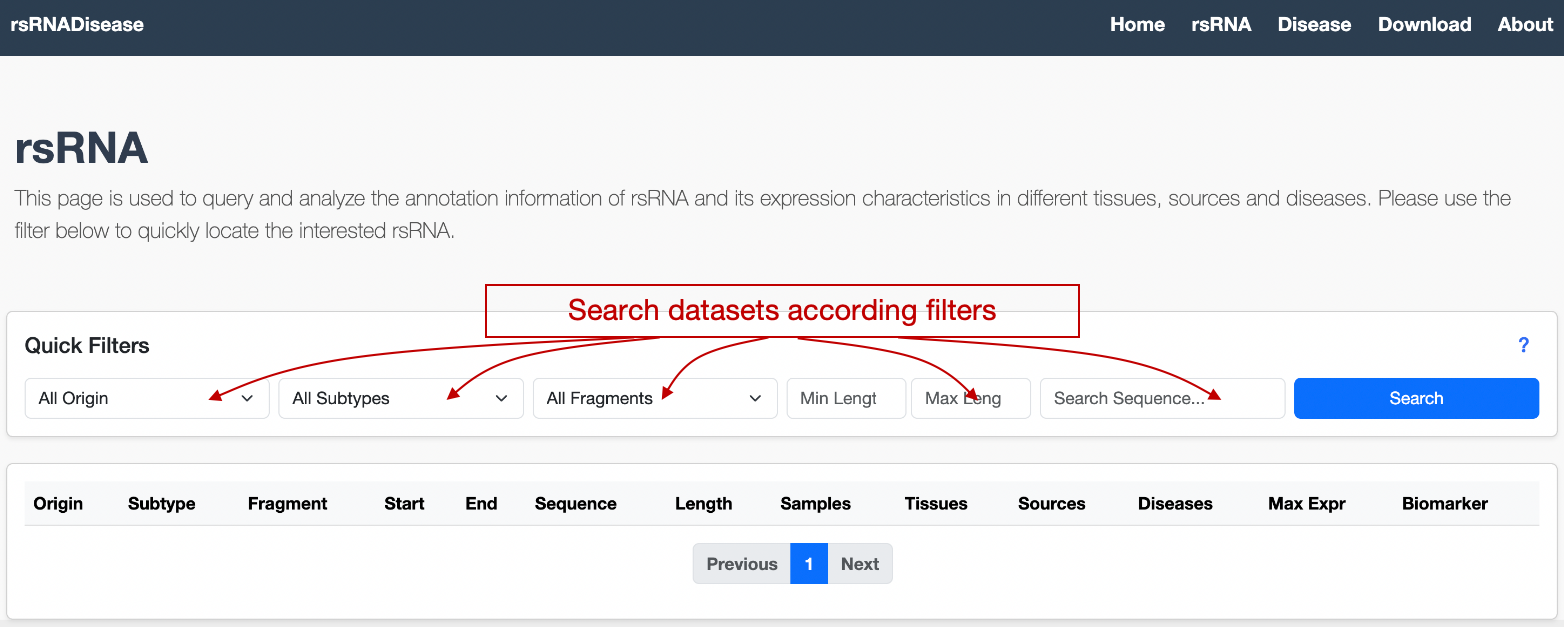
On the rsRNA page, users can explore individual rsRNAs by origin, subtype, fragment, length, and sequence filters. Multiple or single filter criteria can be applied simultaneously to refine the search and obtain the desired rsRNAs.
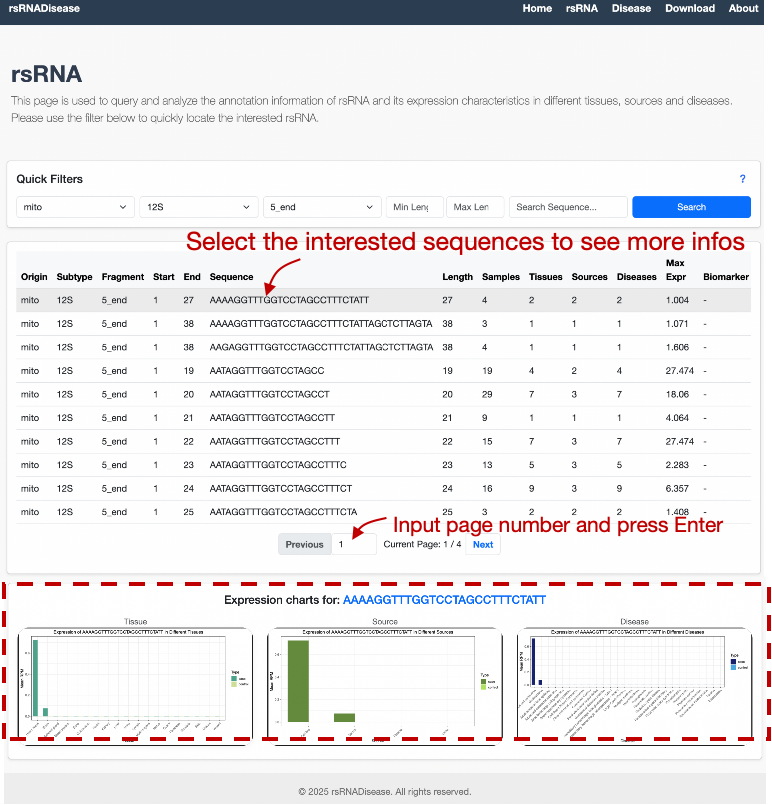
For example, users may be interested in rsRNA sequences derived from the 5' end of mitochondrial 12S rRNA.
The rsRNA sequences satisfying the criteria will be displayed as shown below.
Column Descriptions:
- Origin indicates whether the rsRNA is nuclear-encoded or mitochondrial-encoded.
- Subtype includes different rRNA subtypes (5S, 5.8S, 12S, 16S, 18S, 28S, 45S).
- Fragment represents the rsRNA’s originating region (5′ end, 3′ end, or internal).
- Start and End indicate the reference start and end sites.
- Sequence shows the rsRNA sequence, and Length indicates its length.
- Samples, Tissues, Sources, and Diseases represent the number of occurrences of this sequence across different samples, tissues, sources, and diseases, respectively.
- Max Expr denotes the maximum expression value observed among samples.
- The Biomarker label indicates whether the sequence is one of the identified signature biomarkers.
For rsRNAs that satisfy you query, outputs are presented in the form of a table. You can click Previous or Next to switch between pages, or input the page number and press Enter to jump to the specified page.
Click a specific sequence to view the expression distribution of the individual rsRNA across different tissues, sources, and diseases.
* Note: You can right-click to download the expression distribution figure.
From the Biomarker Table on the Disease Page, users can go to the rsRNA page to view details of specific rsRNA sequences.
Starting from a Dataset
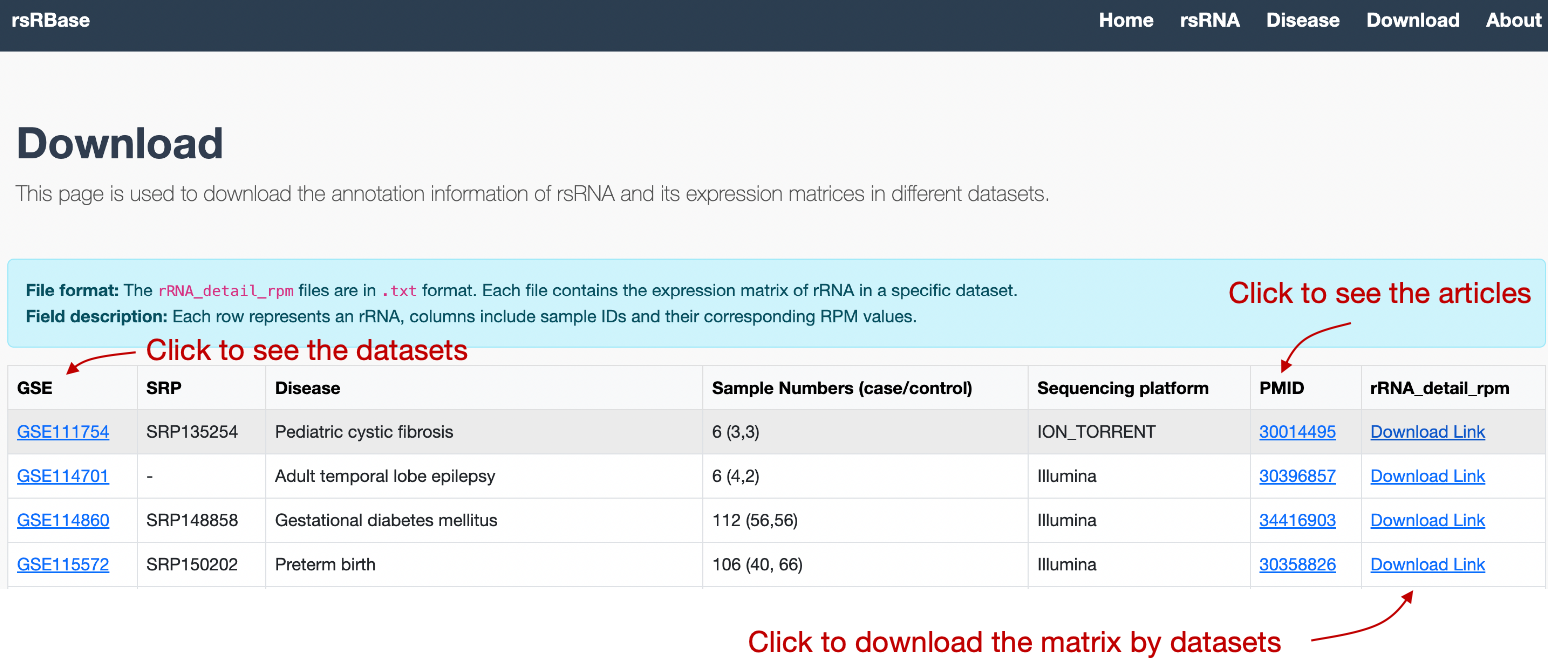
On the Download page, we can download the annotation information of rsRNA and its expression matrices in different datasets.